Identifying CAN bus Devices using Traffic Analysis
Summary
In this post I will cover how I use traffic analysis to determine the various functions of an unknown CAN bus protocol. I’ll use this analysis to map CAN bus addresses to physical devices, and ultimately allow me generate predictable effects by spoofing the protocol.
The Challenge
HACKtheMACHINE is a maritime cyber contest hosted by the United States Navy to raise awareness in the computer security industry about challenges and threats facing maritime networks. During the 2020 and 2021 HackTheMachine competitions, teams were given the output from a NMEA2000 logger of a network of devices using a proprietary CAN bus protocol and had to determine various aspects of the CAN bus devices.
Previous posts covered how I extracted CAN bus frames from a NMEA2000 log of a mixed network, and how I broke the CAN bus data field into smaller data types known in SAE J1939 as signals. This post is the payoff those posts were leading up to, where I analyze the protocols to determine their function and correlate them with the physical devices seen below.
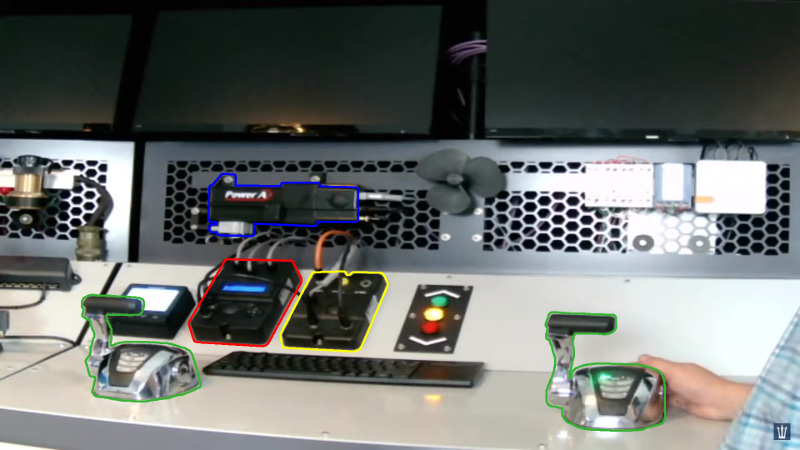
The photo above is a frame of the video demonstrating the target system used in this competition. I’ve highlighted the devices of interest. The two green devices are control stations. The red box is a control unit. The yellow box to its right is a shift unit. The blue unit mounted to the wall is a mechanical actuator.
The mechanical actuator’s output is expressed through the propeller spinning, so I do not expect to see it transmitting to the network. In the previous posts, I determined there were 14 CAN bus devices using 9 different protocol formats. Now I need to figure out how they’re related to these three devices.
Traffic Analysis
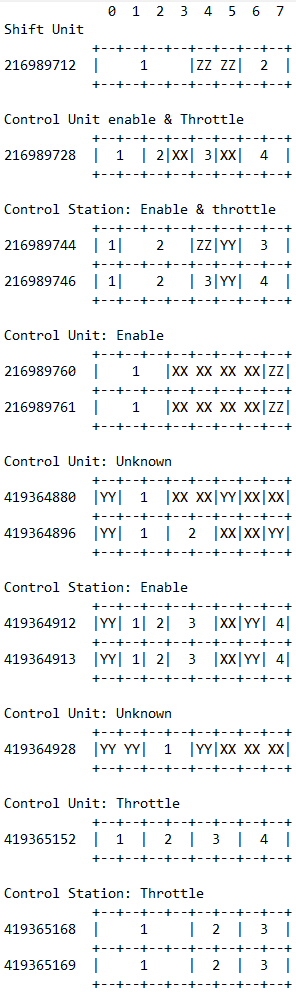
In a previous post, I broke down the CAN bus data bytes into smaller fields that I’ll be referring to as signals, using SAE J1939 nomenclature. I’ve enumerated each signal, except for signals that are always constant (denoted as ZZ for constant zero, XX for constant 0xFF, and YY for any other constant value). In this post I’ll reference each signal using the CAN bus identifier hyphenated with a signal (ex: 216989712-1, 216989712-2).
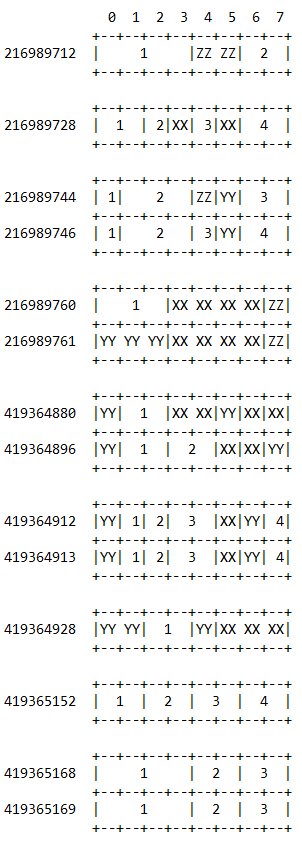
The CAN bus device 216989761 only transmitted a constant value, and so I will not be able to determine any meaning from it. However, there is a neighboring device 216989760 that has a similar data format that may help determine the function of both.
I created a script to plot each signal over time to allow me to correlate each signal’s behavior with other signals to determine a relationship. Of course correlation does not imply causation normally, but as we have control stations feeding input into the control unit which then sends commands to the shift unit and actuator, I’m willing to assume causation here.
Time Span
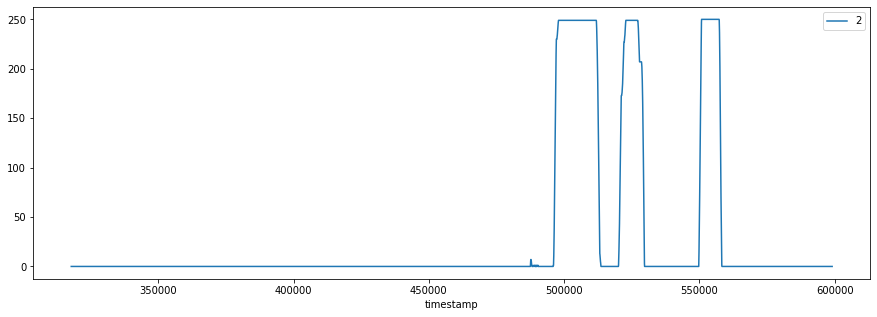
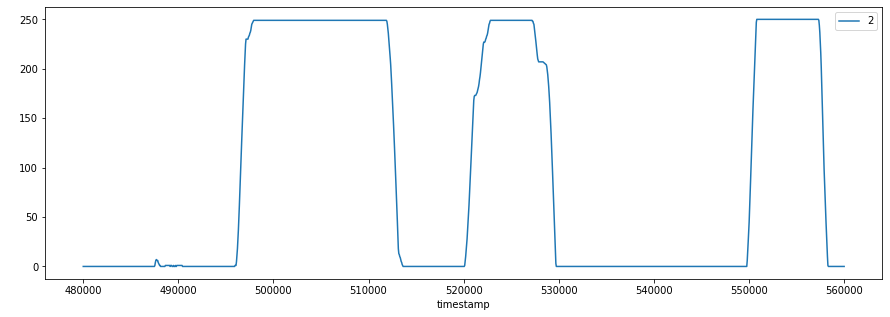
While reviewing multiple signals, I didn’t notice any changes in values except for between the timestamps of 480000 and 560000. Limiting my analysis to this timespan will help me to narrow my analysis and magnify smaller changes in values, as seen below.
Complete timeline:
Limited to activity timespan:
Throttle System
The following are three signals from different devices that have a strong correlation.
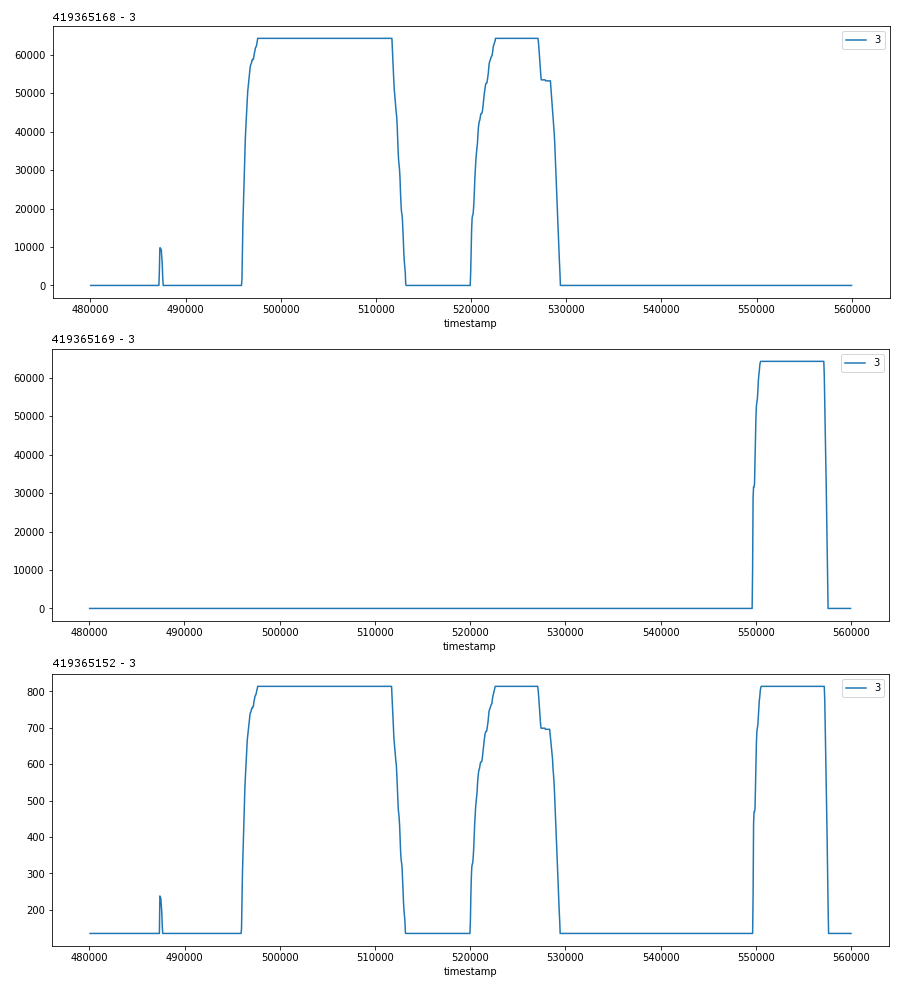
I believe that the first two (419365168-3, 419365169-3) are separate control stations and their input is accepted by the control unit which determines which control station is active, and sends their input (via 419365152-3) to the manual actuator.
Shift Control
Another signal (419365168-2) from the same control station (419365168), shows us that the second push in throttle was actually in reverse.
But this reversal isn’t reflected in any of the signals from the control unit (419365152), which makes sense as it is just telling the actuator how fast to go (a function of magnitude), while it is the purpose of the shift unit to communicate the direction.
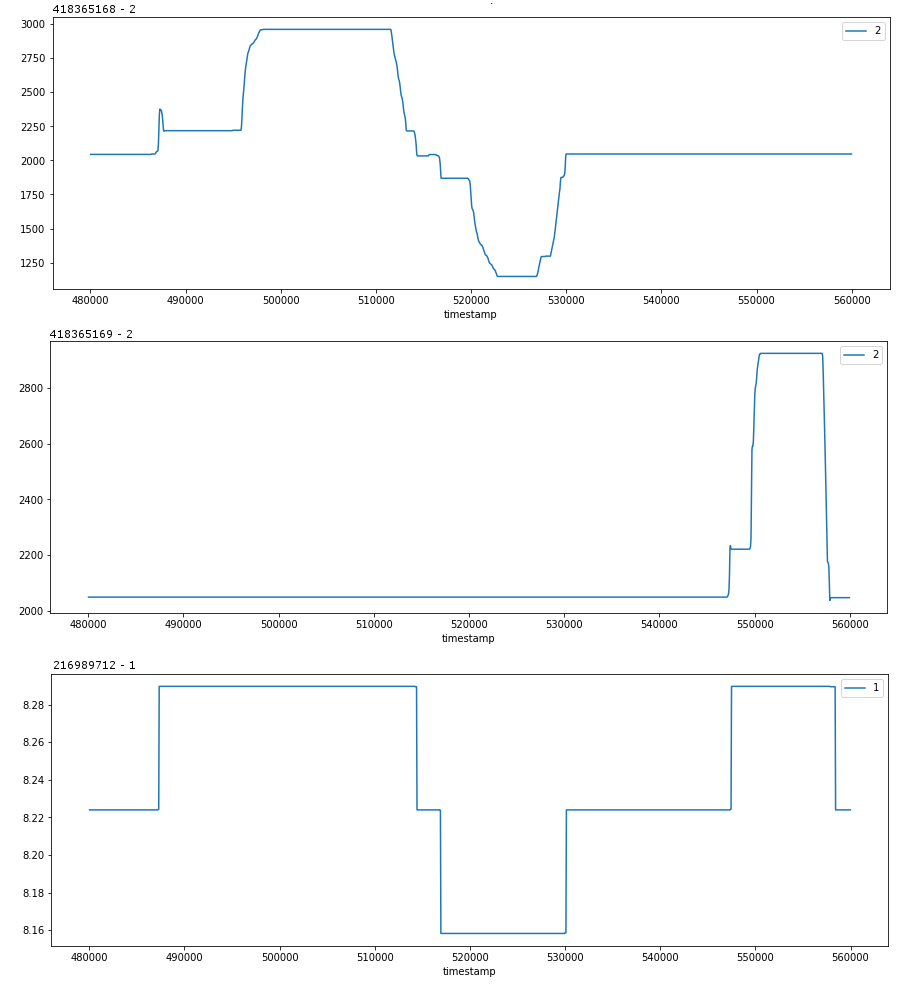
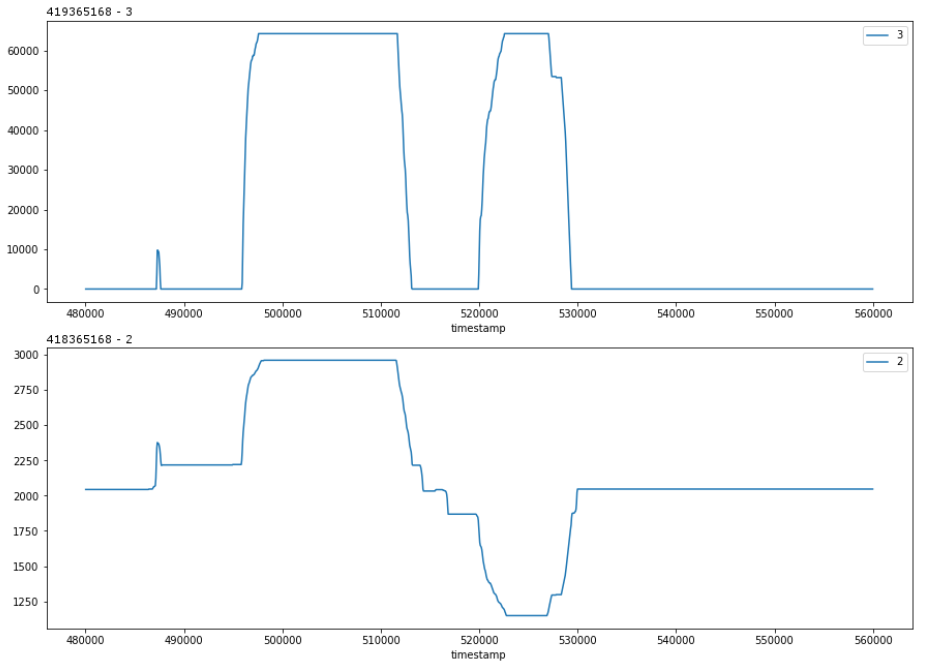
The signal from 216989712-1 matches well with the vector data from the control stations (419365168-2, 419365169-2).
Control Enabling
This throttle system has two control stations that can provide throttle commands, but only one control station can be enabled at a time.
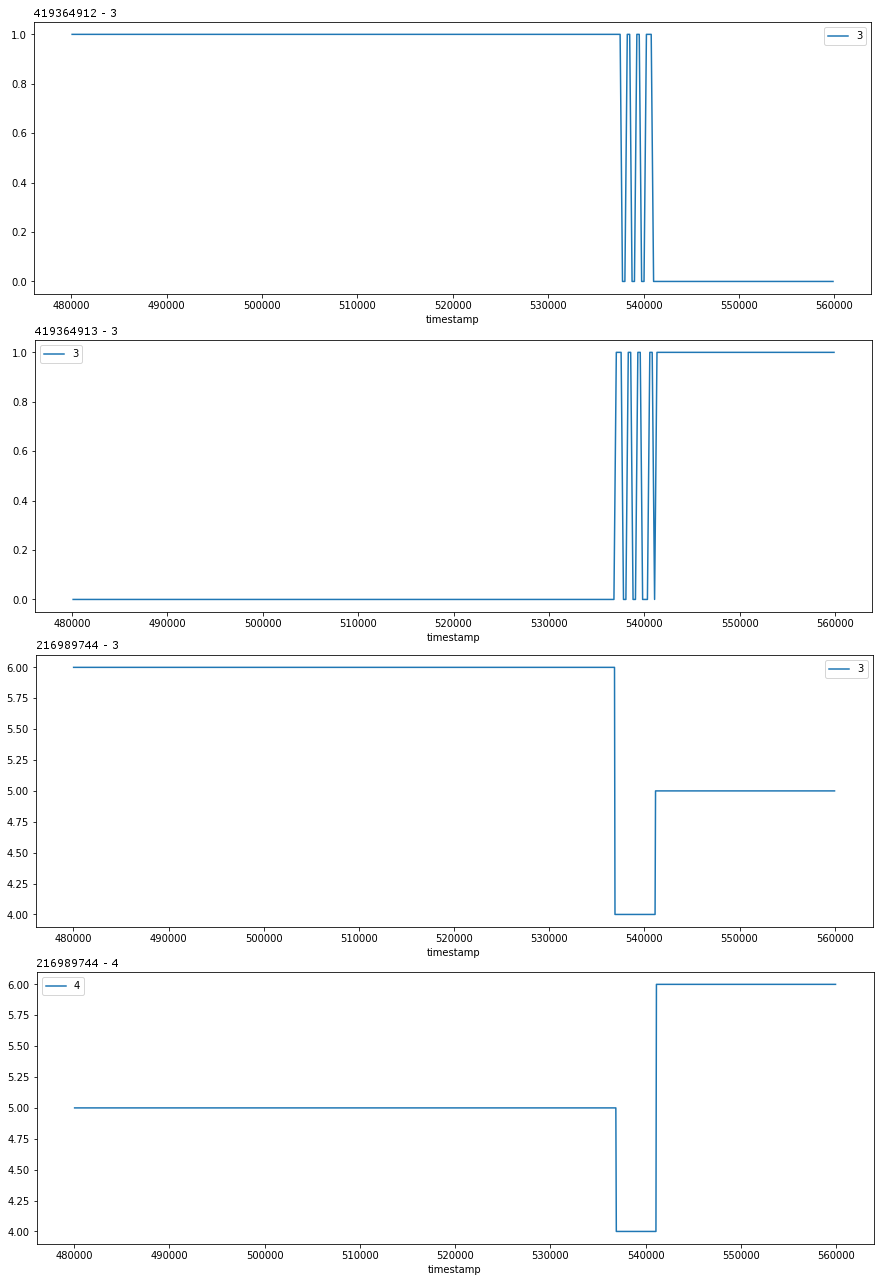
These signals change values during a pause in throttle data. Prior to these signal changes, one control station was sending throttle data, then after the signal changes the other control station began sending throttle data. These behaviors lead me to assume that these signal changes communicated the station selection.
The first two signals come from different device addresses (419364912 and 419364913) and the last two signals come from the same address (216989744). I assume the first two signals are the control stations stating their desire to be enabled, with the last two signals coming from the control unit declaring what the enable status for each station is.
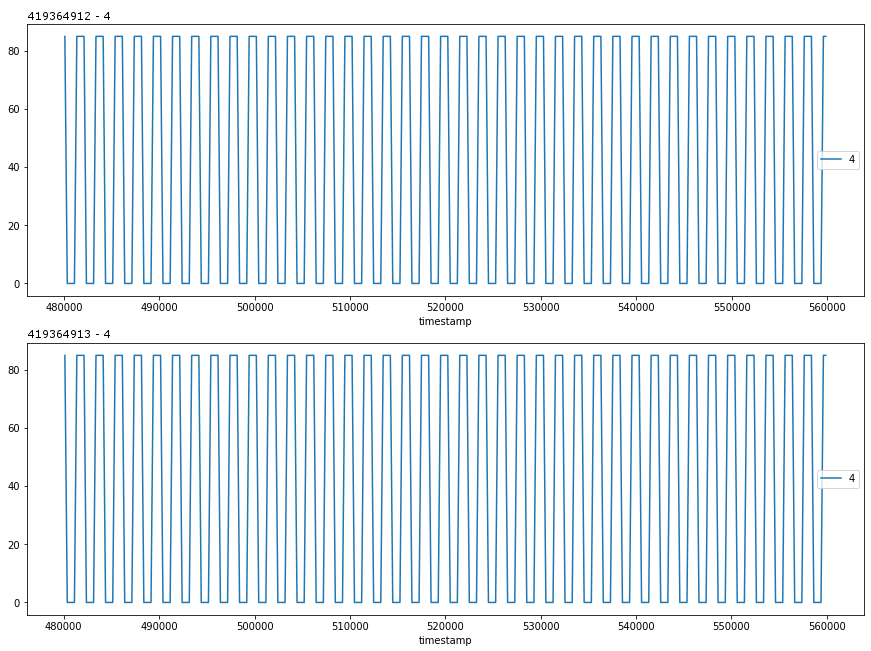
Clock Signals
Notice how both control stations appear to send a clock signal when neither station is enabled. These control stations also transmit a complete clock signal in their data as follows.
Results
Now there are 24 non-constant signals, but I’ve only gone over 10 of them, as the others appear to have redundant functionality. The following is the CAN bus signal breakdown with the associated device.
Conclusion
Over three posts, I’ve shown how I identified the CAN bus traffic, dissected its data into signals, and then analyzed the signals to determine their function. Now I would be able to introduce fake signals into the system to cause the “boat” to run at full speed forward or reverse. Also, due a property of CAN bus communications which makes it easy to zero out data, I force the throttle to idle and leave the “boat” helpless in the water
This research was generated from a single log file with no interaction with the target systems. Given more time and hands-on interactions, I could refine my assumptions about each signal.
Source logs and code associated to this post can be found at https://github.com/VirusFriendly/HackTheMachine-Notes
Special thanks to Fathom5, Booz Allen Hamilton, and the United States Navy for providing the opportunity to gain hands-on experience with maritime networks, and to CaptainHaggis for review and feedback on this post.